In fact, I've been thinking more and more about the use of tools like site selection models in the practice of conservation: what they do, the political economy behind their production, and how people use them.
And so I've been looking more and more into how "big data" is coming to bear on the environment. I was scheduled to give the paper below at the recent Dimensions of Political Ecology conference at the University of Kentucky, but my session was already jam-packed! So I'm posting it here instead. I make several arguments in the paper: 1) though much of what we hear about big data comes from the realms of healthcare, academic research, and corporate finance, new kinds of data analytics are indeed coming to bear on familiar territories for political ecologists: conservation, agriculture, resource extraction, and the body; 2) political ecologists are well-equipped to tackle big data; 3) political ecology may in fact offer a unique perspective to critical data studies in general, beyond the realm of conservation and development. These arguments are somewhat superficial here, nor is the paper fully referenced. It is a first draft and I appreciate any feedback you may have:
----
My research focuses on the tools of environmental governance. I’ve looked at ecosystem assessment methodologies that produce viable markets in nature; my dissertation is looking at the political economy of new visualization tools and models, and data collection techniques being brought to bear on coastal land loss and marsh restoration in Louisiana. I’m asking: how are these tools produced and utilized and with what effects in the service of adaptive management and the valuation of ecosystem services. So when I saw this John Deere promotional video, I couldn’t help but be intrigued. [It’s a little slow-moving – you might fast forward to the 3 minute mark].
Promoters of these kinds of “data-driven solutions” to agriculture, business, health, government, and conservation suggest that a frontier of existing and constantly coming online information – big data - and the new tools and techniques associated with compiling and making sense of it - can fundamentally change how individuals and institutions go about decision-making. Political ecology (PE) has always concerned itself with the question of how land managers make decisions, with a critical eye towards contextualizing these decisions within broader political and economic processes and forces. So what if anything does PE have to say about this particular situation?
PE, I argue, has the conceptual tools and interests to engage with these kinds of situations. PEists should be engaging with these kinds of situations – in fact, given its long-standing emphasis on questioning the scalar and political premises of knowledge’s production, circulation, and application it is uniquely positioned to, in ways that would add to the conversation around new forms and objects of data analysis as a whole. Not only should it, but in many ways it must if it want to continue being its critical role as a “hatchet” for what science, state, and capital expect from those working the land.
In this paper, I spell out what big data is, to illustrate briefly three different ways data is being taken up in environmental governance, and ultimately, what PEists can do with big data – what we can ask, what we can show, and how we might practice it ourselves.
 |
| "The Body as a Source of Big Data." http://ihealthtran.com/wordpress/2013/03/infographic-friday-the-body-as-a-source-of-big-data/ |
What is big data?
Even just spelling out what big data is an improvement upon most accounts, which give it an unearned mythical status:
Simply put, because of big data, managers can measure, and hence know, radically more about their businesses, and directly translate that knowledge into improved decision making and performance. Harvard Business Review
It’s crucial yet difficult to pick apart what we mean by big data. It has a certain parallax – that is, it’s an object that looks different when we look at it from different advantages. At one level we might say big data necessarily comprises an object, a method or practice, and a tool – on another level it’s: data, new tools for collecting it, and new tools for analyzing and making sense of it. Let’s look at each in turn.
Object
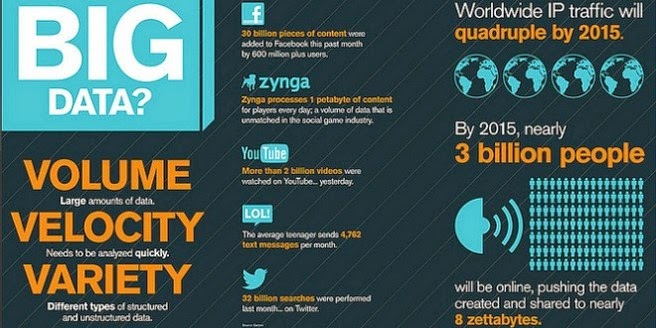 |
| "Big Data? Volume, Velocity, Variety." Some also add a fourth v: value (see below!) http://www.wired.com/2013/06/is-big-data-in-the-trough-of-disillusionment/
Method
Whatever the data itself looks like, it won’t speak for itself. There’s a practice to big data, and there are two important moments to consider here. Data collection First, big data is marked by the use of new technologies that can record more and more observations, more and more rapidly, and perhaps above all, more and more remotely - that is, at some (physical, social, computational) distance from where, who, and what is in fact sifting through the data. Some of the foremost big data stories we hear about fall into one – or often more - of three kinds of a remote governance: 1) Enhanced remote sensing (RS). Political ecologists have regularly both employed and critiqued RS (Turner 2003), but: 1) this is in many ways RS on steroids – one company, Skybox, is interested not simply in capturing land cover, but extremely fine details of land use (such as the number of cars parked at a mall on a given day); 2) one of the interesting new developments we’re seeing is the integration of remotely sensed data and user-provided data. For instance, satellites are capturing spectral data in west Africa, which algorithms then parse into general land cover categories. Managers of a program out of Cornell then provide incentives to local pastoralists to actually go out and confirm, or “ground truth” the cover type. As my friend Patrick Bigger put it, “It's like Uber surge pricing for environmental surveillance.” 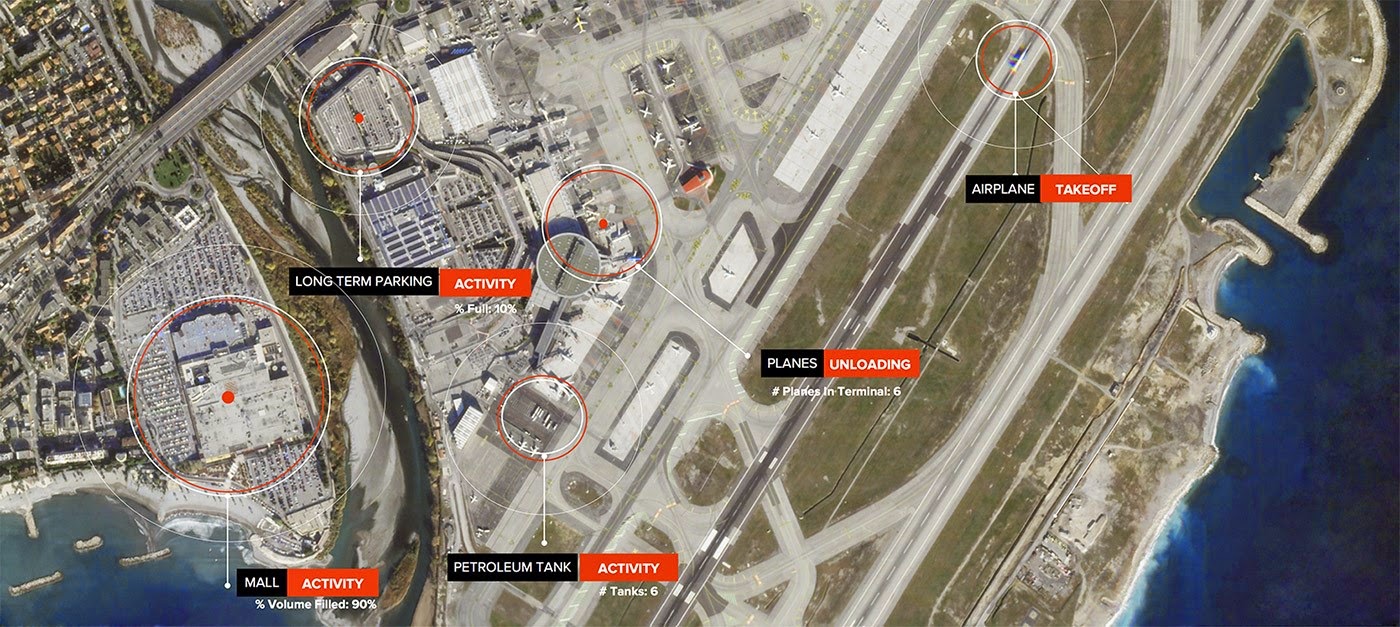 This leads us into the second kind of remote sensing: 2) self-reported data. Data collected unconsciously (or sometimes consciously) – with permission or without it – from location-based apps or perhaps from website activity (your “clickstream”). This kind of data collection ultimately raises important fears about privacy. But those in the “quantified self” movement embrace collecting as much data as they can about themselves, in the hopes of optimizing say their health or even their investment strategies; 3) Finally, an emerging connectivity of devices – from smart phones to servers to satellites - gathering, transmitting, and analyzing data at a distance has some tech leaders envisioning a so-called “internet of things,” an objectification of everything – literally everything, from trees to buildings (see video below) – into governable sources of data. California has set up water level sensors to give them real-time feedback on lake and reservoir levels, and the USFS is experimenting with real-time monitoring of all sorts of different forest measures. |
Data analysis:
The promise of new sources of information means little, however, without the conceptual and practical apparatuses that allow the data to be understood (as some might put it, for the data to become information or knowledge). I’ll name a couple of the key maneuvers “data scientists” make here. I focus on the practice of analysis, but will note the here: analysis is becoming a commodity (what Wilson (2014) calls “Analytics TM”), bringing with it the promise that the world is “infinitely” analyzable. But making the earth suitable for analysis requires first indexing it. For one company, the goal is: “To index the earth the way Google indexes the Internet,” that is to, from each particular observation of the earth’s surface, discretize certain phenomena and values (e.g. extent of deforestation or, as above, number of cars in a parking lot) and then associate these objects with the observation, allowing for easy aggregation, statistical manipulation, and retrieval. Next, for many, the volume of data suggests that traditional tenets of statistical representation can be set aside. When n=N – when the sample of data is in fact the population, when we are able to collect and index all crime data for a city - we do not need to try to extrapolate, which introduces uncertainty in prediction or in analyzing new information (Mayer-Schönberger and Cukier 2013). Instead, simple yet surprising and powerful correlations and trends –for instance that Wal-Mart’s sales of strawberry pop-tarts skyrocket before hurricanes - are enough, enough for Wal-Mart to keep the shelves stocked, but probably not ask why strawberry pop-tarts go so quickly. This has led some – Chris Anderson, famously - to declare “the end of the theory.” Data need no explanation – the trends speak for themselves, allowing for prediction of future events (such as what you’ll order next on Amazon). Data scientists’ final move has been to develop more and better algorithms by which these correlations and predictions can be made. This involves “machine learning” – or the recursive tweaking of equations to “fit,” or properly explain, the data so that predictions can be made. There are generally two kinds of algorithms at play here, which will be familiar to those working with RS: supervised and unsupervised (It’s also worth noting that even though there are much more advanced algorithms at play (e.g. neural networks) these are the basics, and they have their roots in many of the tools that social scientists might use: PCA, linear regression, and so on.) I’m going to skip over an explanation of the differences between these, but you might get the impression that “unsupervised algorithms” are artificial intelligence come to life. While many big data proponents suggest that the “data speak for themselves” – and that’s what the phrase “machine learning” suggests, that machines alone can discover and interpret patterns - data managers will be the first to note that even unsupervised algorithms require active intervention and subjective choice: clustering – an important unsupervised algorithm involves an initial choice on the part of the analyst as to how many clusters to look for; clusters must also be meaningfully interpreted.
 |
| Ayasdi's analysis of key basketball "positions" as illuminated by the visual topology of the data. http://www.ayasdi.com/wp-content/uploads/_downloads/Redefining_Basketball_Through_Topological_Data_Analysis.pdf |
Tool
Regardless of whatever fanciful things algorithms can do to “reveal” the pattern of a dataset and make predictions, these results need some translation out of R or whatever analysis software package they’ve been developed in. While proponents suggest data speak for themselves, it might be more accurate to claim that data visualize themselves. That data patterns and results can and must be seen is a tenant of data science, meaning that whatever goes on in the analysis should be translated into some visual medium, all the better to communicate with decision-makers around. And so we see alongside new analytics, new tools: for instance, “dashboards” and “decision support tools” that collate data and results, providing decision-makers “levers” to pull to move forward.
 |
| Palantir's tool for "adaptively managing" salinity levels in the San Joaquin Delta. https://www.palantir.com/2012/09/adaptive-management-and-the-analysis-of-californias-water-resources/ |
What does big data have to do with ecology?
Increasingly, conservationists, other land managers, and powerful actors in environmental governance (financiers, policy-makers, etc.) are adopting these tools. Conservation has a long history of the use of technology for management, all the way from mandating best available pollution control technologies to RS and GIS to big data today. For many conservationists, the claim is explicitly that new technologies “can help save the planet.” This is an important claim to investigate on several accounts: 1) the word help is important, but is always vaguely defined. To what extent is this a proposal that ecological degradation simply needs a technical fix (as opposed to addressing the root social causes)? 2) the claim embeds a particular scalar argument (save the planet, not just certain ecosystems). Political ecology has always been concerned with both of these kinds of questions. I offer three very short vignettes simply to illustrate what happens when big data and conservation meet, and to point to areas of research where political ecologists should be working.
 |
| "Finally, Data You Can Actually Use." Climate Corporation. http://www.climatepro2015.com/ |
Smart farming
Smart farming is everything in the John Deere promo linked to above. Smart farming advocates aim for the integration of field, equipment, and meterological data to support precision planting and optimizing crop yields. The idea is that this data – made accessible through interfaces and dashboard tools – can help farmers limit unnecessary applications of fertilizers (through near real-time, sub-meter access to satellites able to pick up near-infrared light, allowing insight into nutrient deficiencies and growth rates), and plant the right kinds of crops in the right place given current climatological and soil conditions. A number of different firms have set themselves up in this market, including Skybox, which bills their recently launched private satellites as providing “Big data. From space,” and Climate Corporation, which collects public weather data, translating it onto a private platform to sell to farmers (and was recently acquired by Monsanto).
Valuing nature
While smart farming aims to increase the value of agricultural production by conserving inputs, conservationist organizations themselves are aiming to use big data to value ecosystems in their own right. They have set up a couple of cases using social media data to reveal the otherwise unknown or, by default, zero economic value of nature. In California, The Nature Conservancy uses user-generated data from the eBird app to identify where migratory birds are during particularly important intervals and then pays rice farmers in key gaps along the birds’ routes to keep their fields flooded for longer, preserving habitat that can be hard to come by in the context of the state’s long drought. These mini-wetlands are called “pop-up habitats,” and TNC is also talking about it in terms much like smart farming, calling it “precision conservation.” Elsewhere, researchers from the Natural Capital Project – a coalition of academic ecologists and conservation non-profits – have used Flickr data to estimate the recreational values provided by different ecosystems, as a way of making clear to policy-makers the job and revenue creating aspects of nature. Instead of providing surveys to tourists to ask them how much they visited a national park, the researchers used Flickr data as a proxy for visitation, and to guess at how environmental degradation at these parks might change recreational attendance.
Hedging bets
Finally, some data analytic firms are pushing the boundaries of new data forms in their use for valuing nature. These firms write algorithms that sift through satellite imagery and other economic data to make sense of and correlate environmental and economic change, then package this information and sell it to hedge funds in need of investment advice. For instance, Skybox says that it can monitor say gold production from mines across the globe, giving investors in real time literally a bird’s eye view of this facet of the economy. Without having to wait for Newmont Mining’s quarterly statement, investors can with the help of Skybox’s algorithms, more or less spy on the mining giant’s operations to get a feel for whether output is on the rise. The same goes for logging in tropical rain forests, oil and gas wells, and, again, crop condition. In the case of forest monitoring, Skybox suggests that not only can this data be useful for investors, but for activists as well. They’d like to sell their analytics to both sides.
Questions to ask and possible perspectives
1. Material effects
These three vignettes, brief as they are, raise a number of questions and suggest several general lines of inquiry. First and foremost we need to better understand what sort of material impacts are detectable and attributable to big data in practice. What difference does big data analysis make in the transformation of certain landscapes, in comparison to earlier modes of governance? Might it increase the speed at which change occurs (a la pop-up habitats) or improve conservation outcomes by illuminating unseen trends? What is the environment effect of, for instance, Palantir’s tool for managing Delta water salinity? Are water levels actually optimized? What and who do the landscapes reflect? What in ecological terms is a “pop-up habitat”? Moreover, we could also better understand and communicate the environmental impact of server farms: the greenhouse gas emissions stemming from work and life now situated in “cloud” space, the SO2 emissions from diesel generators, and the water usage to cool down servers.
These three vignettes, brief as they are, raise a number of questions and suggest several general lines of inquiry. First and foremost we need to better understand what sort of material impacts are detectable and attributable to big data in practice
 |
| "Data is the new oil" http://dismagazine.com/issues/73298/sara-m-watson-metaphors-of-big-data/ |
2. Data as waste and value
Political ecologists focused on the intersection of cultural and environmental politics have fruitfully been investigating questions about waste and value, noting that capitalism relies on discursive translating bodies and landscapes as alternatively waste and as valuable (Moore 2013; Goldstein 2013; Gidwani and Reddy 2011). What is previously deemed waste(land) can be enclosed and incorporated as value, and valuable labor can be laid to waste (only to be speculated upon as someday bearing value again). In many ways this is exactly how data managers talk about big data - as a kind of hoard, a resource to be mined, something that in a kind of parallax view, splits the difference between waste and value [I'm grateful to Mohammed Rafi Arefin for making this point clear to me]. They believe that there is value in the data waiting to be realized, just as oil is waiting in the ground, ready to be extracted, refined, and transported to realize its value. This may help us understand data privacy issues in a new way - the unsolicited collection and analysis of data may be a sort of enclosure of otherwise waste information. Big data also more directly promises to be (environmental) economists’ holy grail: long have they sought ways to understand how people value things whose value is not revealed by markets. With big data capturing all sorts of “traces” we leave behind as we click around the Internet, the idea is this data can serve as proxies revealing preferences. When there exists a dataset like Flickr, the story goes, we have a much better sense of just how much people value wildlife.
No matter what, we should not accept some managers’ techno-optimism without reservation. Like hoarders, analysts fear being overwhelmed by their data. The actual work of having to sort through the data mess just as easily gives the analyst a sense of dread as it inspires hopeful visions of data-driven decision-making. Acknowledging data mining’s limitations, managers vividly describe the problem of having to sort through too much stuff to get to the valuable parts as one of powerlessness. “Without a clear framework for big data governance and use,” one consultant writes, “businesses run the risk of becoming paralyzed under an unorganized jumble of data.” For one manager reflecting on a massive dataset, “the thought of wading through all THAT to find it stops you dead in your tracks.” Another similarly evoked the feeling of being stranded at sea: “There’s a lot of water in the ocean, too, but you can’t drink it.” Continuing the drowning theme, others simply acknowledge that in big data analysis there is a risk that the analyst will be overwhelmed by inconsequential results: "This set of patterns [in a big dataset] often contains lots of uninteresting patterns that risk overwhelming the data miner.” Indeed, data miners are anxious about not finding the true or most interesting pattern, and instead finding only what they want: “Data is so unstructured and there’s so much out there, you are going to find any pattern you want … whether it’s true or fake.” They fear finding themselves in the data. This is analogous to the “ecological anxiety disorder” (Robbins and Moore 2013) ecologists find themselves in where they either see their concepts as too normative or that humans are a negative influence in ecosystems. We should leverage this concern. As political ecologists might ask what climate change adaptation programs in the developing world expect of their target audiences, we can ask, what do new digital technologies for conservation, farming, and environmental governance expect of their users?
I think in many cases we’ll find that these tools expect their users to be rational actors who predictably respond when provided a particular set of informational inputs. That is, the conceit of these tools is to ignore the political economic contexts which shape the extent to which users will even be able to acknowledge, decipher and act upon them (as well as the political economic contexts of their making). There are good reasons, political ecologists know, that a US farmer – especially a small-scale one, but we can also think about the average age of farmers, the fact that most work off-farm jobs - will be unable to perform the sort of decision-making John Deere presents. Yet it is not just these farmer-centric limits to analysis that will be key to recognize – we can think also about the political economic structure of data collection and analysis today: its centralization (like GMO seeds, farmers may or may not own their data) and monopolization (Monsanto recently bought out Climate Corporation), and the limits to “data-driven” action these introduce. Data and new tech are not black boxes for farmers just because they are technically overwhelming and once removed from farmers, but because they are socially boxed off as well.
Political ecologists focused on the intersection of cultural and environmental politics have fruitfully been investigating questions about waste and value, noting that capitalism relies on discursive translating bodies and landscapes as alternatively waste and as valuable (Moore 2013; Goldstein 2013; Gidwani and Reddy 2011). What is previously deemed waste(land) can be enclosed and incorporated as value, and valuable labor can be laid to waste (only to be speculated upon as someday bearing value again). In many ways this is exactly how data managers talk about big data - as a kind of hoard, a resource to be mined, something that in a kind of parallax view, splits the difference between waste and value [I'm grateful to Mohammed Rafi Arefin for making this point clear to me]. They believe that there is value in the data waiting to be realized, just as oil is waiting in the ground, ready to be extracted, refined, and transported to realize its value. This may help us understand data privacy issues in a new way - the unsolicited collection and analysis of data may be a sort of enclosure of otherwise waste information. Big data also more directly promises to be (environmental) economists’ holy grail: long have they sought ways to understand how people value things whose value is not revealed by markets. With big data capturing all sorts of “traces” we leave behind as we click around the Internet, the idea is this data can serve as proxies revealing preferences. When there exists a dataset like Flickr, the story goes, we have a much better sense of just how much people value wildlife.
No matter what, we should not accept some managers’ techno-optimism without reservation. Like hoarders, analysts fear being overwhelmed by their data. The actual work of having to sort through the data mess just as easily gives the analyst a sense of dread as it inspires hopeful visions of data-driven decision-making. Acknowledging data mining’s limitations, managers vividly describe the problem of having to sort through too much stuff to get to the valuable parts as one of powerlessness. “Without a clear framework for big data governance and use,” one consultant writes, “businesses run the risk of becoming paralyzed under an unorganized jumble of data.” For one manager reflecting on a massive dataset, “the thought of wading through all THAT to find it stops you dead in your tracks.” Another similarly evoked the feeling of being stranded at sea: “There’s a lot of water in the ocean, too, but you can’t drink it.” Continuing the drowning theme, others simply acknowledge that in big data analysis there is a risk that the analyst will be overwhelmed by inconsequential results: "This set of patterns [in a big dataset] often contains lots of uninteresting patterns that risk overwhelming the data miner.” Indeed, data miners are anxious about not finding the true or most interesting pattern, and instead finding only what they want: “Data is so unstructured and there’s so much out there, you are going to find any pattern you want … whether it’s true or fake.” They fear finding themselves in the data. This is analogous to the “ecological anxiety disorder” (Robbins and Moore 2013) ecologists find themselves in where they either see their concepts as too normative or that humans are a negative influence in ecosystems. We should leverage this concern. As political ecologists might ask what climate change adaptation programs in the developing world expect of their target audiences, we can ask, what do new digital technologies for conservation, farming, and environmental governance expect of their users?
 |
| Drowning in big data. Intel. http://www.intel.com/content/www/us/en/big-data/big-data-101-animation.html |
3. Visualizing like a state
More specifically, with the increasing emphasis on data-driven solutions to everything, we should expect to see “analysis paralysis”, or situations in which too many options and too much information are presented to decision-makers for them to be able to take any coherent action. This may be particularly true for policy-makers, the kind targeted by tools like Palantir’s salinity monitor:
…our analysis tools “can give policy makers maximum insight into the relationships between the variables that affect the Delta’s health and allow them to make decisions that appropriately weigh the interests of all parties involved.” Palantir
What exactly is “maximum insight”? What does it mean for tools to objectively weigh interests? There are many reasons that the kind decision-making subjects envisioned here doesn’t and won’t actually exist. Many actually existing policy-makers do not even know what kinds of tools are technologically possible – they don’t know what to ask for from programmers. The ones I’ve been talking to tell me things like “someone told me I wanted a dashboard” – in other words, they do not actually know they need the kind of easy to use tools Palantir is offering them, but are instead convinced by the discourse that tells them they do need such tools. And even if decision-makers do seek out dashboards, what they’re often asking for is the “easy button,” the button that gives them an answer spelling out what to do. Yet many programmers will reply that that’s something they can’t give them. It’s not their place to give the one answer, but to provide only maximum insight and present all interests, letting the decision-maker do the rest and pinning accountability on them. Or, merely “suggesting” changing the type of seed to plant, like the tool in the John Deere video. In other words, tools lure decision-makers with the promise of easier, more defensible basis for their choices, while at the same time deflecting as much of that responsibility back towards them.
4. Ideologies of Nature
Finally - and I’m grateful to Dan Cockayne for pushing me on this – we should ask how big data and analysis rely upon and change ideologies of nature. As Neal Smith (1984) argued, not only does capital physically produce nature, but it produces ideologies of nature, bourgeois notions of capital, race, gender and so on as natural. How does TNC’s creation of “pop-up habitats” change how we think about nature? In what ways might we start to think about environmental protection in terms of “surge-demand” and “precision” and understand ecosystems as “real-time” or “pop-up” events? What about the reverse- when instead of talking about nature through data, we start to conceptualize data using our existing languages for talking about nature? What is the effect of describing computation as happening in an “environment,” or more perniciously, naming data as a resource – an object like oil, coal, or gas to be mined and extracted?
Conclusions
What can PE in particular say to the larger conversation surrounding big data? Below, I name three points political ecology can make in this discussion, three points that summarize the questions and perspectives sketched above. I end with an argument for a political ecological practice of big data.
I believe political ecology is equipped not only to adequately analyze the kinds of situations I sketched above, but that through these sorts of “knowledge politics” critiques it can usefully inform critical data studies. Much in the way of reflexivity on big data concerns its implications for privacy, its heightening of the digital divide, and its use as an academic research tool. Much as political ecologists know the problematic epistemologies of remote sensing, these reports usefully point out that social media data in particular cannot provide the kinds of information or insights many analysts want it to – much data isn’t geotagged, and even the images or tweets that are do not necessarily indicate that the person can be adequately related to that location (boyd and Crawford 2012; Crampton et al. 2013; Wilson 2014). But we should not stop at these critiques of big data as our own method for understanding the world (nor stop at crucial questions of what work big data does as a governance “meme” – Graham and Shelton 2013) – we must extend them to the particular situations in which big data becomes an applied analysis tool regardless of its foundational epistemological flaws. In terms political ecologists are familiar with: we can illustrate not just data’s moment of production, but its moments of circulation and application. Indeed, Crampton et al. (2013) call for a kind of contextualization or “situating” of big data, as research tool if not means of decision-making. This kind of intimate grounding through case studies is what political ecologists excel at.
We must articulate that big data is produced, and we must show how and why. Not content to merely illustrate that new technologies constrain or afford certain actions by governance actors or land managers, we should provide “chains of explanation” beyond our research contexts back to larger forces at play. We can provide crucial inroads into questions like: what’s the political economy that allows a firm like Skybox to index the earth? Who’s producing these tools? How do private firms rely on and generate value out of public data? How does big data gain “value” for firms or farms? What is it that allows data name value in the world, as TNC and the Natural Capital Project believe it does?
Likewise, big data is something which is practiced with people, in spite of the mystification of algorithms as wholly autonomous entities. Political ecology has a long-standing concern with understanding the concrete, embedded decision-making and social situatedness of land managers – as opposed to discursively idealized subjects (like rational actors) or, to use one of Piers Blaikie’s images, bureaucrats in airplanes (designing a population stabilization program based on abstract concepts and figures the like of which, Blaikie wryly notes, are not in the minds of two lovers as they lay down to bed. This concern should lead us to consider data managers as very much the kind of land managers Blaikie started from and focused on in his Political Economy of Soil Erosion: “actual people making decisions on how to use land.” I mean this in two ways: 1) those making decisions that have concrete bearing on the treatment of particular ecologies, as when TNC’s data analysts, with the help of their algorithms, decide where to extend migratory bird habitat; 2) I also mean it in the sense that those we traditionally consider land managers – farmers, pastoralists, peasants – are fast become data managers in and of themselves, be it as “smart” farmers or as pastoralists incentivize to go out and ground truth RS imagery.
Finally, we must understand the actual effects and outcomes of new techniques of data management. While it is crucial to recognize how data potentially connects domains in novel ways – i.e. when Skybox syncs ecological data with financial data – we should try not to reproduce discourse that “algorithms will rule our world.” If we do, we miss key resistances and ambiguities. We should remember that Skybox supports activists who feel that the technology can offer more visibility to illegal extraction activities be it in the Amazonian or Appalachia. We should be reminded to look for these fractures and to try to widen them, to realize that we can engage in a “politics of measure” that either questions the very measurability of things (Mann 2007; Robertson and Wainwright 2014) or asserts the strategic utility of doing so (Wyly 2007; Cooper 2014).
Which leads to the last big question to pose here: do we as political ecologists employ big data ourselves in support of our “hatchet and seed” mission? Is data just the object of our critique, along the lines I have laid out here? These are questions human geographers are asking themselves right now (Graham and Shelton 2013, special issue), some seeing it as an opportunity to rethink empirical social science in a more interdisciplinary way (Ruppert 2013), with others more cautious, suggesting big data are the epiphenomena of the real issue, and the real need is to question the datafied production of knowledge, to question the idea that big data is truth that simply needs mining (Wilson 2014). I think political ecologists have a lot to gain by reflexively engaging with the analysis of massive data sets, extending PE’s tradition of sitting critically if sometimes awkwardly (Walker 2005) between political critique and ecological fieldwork, cognizant that its own tools of research are often those it seeks to criticize (a la Lave et al. 2013; Turner 2003).
In short, I’m reminded again of Piers Blaikie, when in the 5th chapter of PESE,he sketches out what a grounded study of peasant political economy in the context of soil loss would look like. Literally sketches out what he calls “a schematic and heuristic device which suggests the way in which these complex relationships (between people, and between people and environment) can be handled.” And what does it look like?
What else but a massive, complex, messy matrix of variables and objects of study (in this case, households? A big dataset. What is his critical relationship to this heuristic? He describes it as a watch – a watch keeps time, but it does not give its user any clue on how to use time. In the same way, the heuristic and the data it organizes are meaningful only in the context of political economic theory – it “maps” political economy onto the case study and “attempts to calibrate part of it precisely.” In other words, political ecologists might have our big data cake and eat it too. I’m not entirely sure what this engagement would look like concretely – the GLOBE project at the University of Maryland-Baltimore County is a likely candidate - but it seems to me that’s where we ought to be headed.
What can PE in particular say to the larger conversation surrounding big data? Below, I name three points political ecology can make in this discussion, three points that summarize the questions and perspectives sketched above. I end with an argument for a political ecological practice of big data.
I believe political ecology is equipped not only to adequately analyze the kinds of situations I sketched above, but that through these sorts of “knowledge politics” critiques it can usefully inform critical data studies. Much in the way of reflexivity on big data concerns its implications for privacy, its heightening of the digital divide, and its use as an academic research tool. Much as political ecologists know the problematic epistemologies of remote sensing, these reports usefully point out that social media data in particular cannot provide the kinds of information or insights many analysts want it to – much data isn’t geotagged, and even the images or tweets that are do not necessarily indicate that the person can be adequately related to that location (boyd and Crawford 2012; Crampton et al. 2013; Wilson 2014). But we should not stop at these critiques of big data as our own method for understanding the world (nor stop at crucial questions of what work big data does as a governance “meme” – Graham and Shelton 2013) – we must extend them to the particular situations in which big data becomes an applied analysis tool regardless of its foundational epistemological flaws. In terms political ecologists are familiar with: we can illustrate not just data’s moment of production, but its moments of circulation and application. Indeed, Crampton et al. (2013) call for a kind of contextualization or “situating” of big data, as research tool if not means of decision-making. This kind of intimate grounding through case studies is what political ecologists excel at.
We must articulate that big data is produced, and we must show how and why. Not content to merely illustrate that new technologies constrain or afford certain actions by governance actors or land managers, we should provide “chains of explanation” beyond our research contexts back to larger forces at play. We can provide crucial inroads into questions like: what’s the political economy that allows a firm like Skybox to index the earth? Who’s producing these tools? How do private firms rely on and generate value out of public data? How does big data gain “value” for firms or farms? What is it that allows data name value in the world, as TNC and the Natural Capital Project believe it does?
Likewise, big data is something which is practiced with people, in spite of the mystification of algorithms as wholly autonomous entities. Political ecology has a long-standing concern with understanding the concrete, embedded decision-making and social situatedness of land managers – as opposed to discursively idealized subjects (like rational actors) or, to use one of Piers Blaikie’s images, bureaucrats in airplanes (designing a population stabilization program based on abstract concepts and figures the like of which, Blaikie wryly notes, are not in the minds of two lovers as they lay down to bed. This concern should lead us to consider data managers as very much the kind of land managers Blaikie started from and focused on in his Political Economy of Soil Erosion: “actual people making decisions on how to use land.” I mean this in two ways: 1) those making decisions that have concrete bearing on the treatment of particular ecologies, as when TNC’s data analysts, with the help of their algorithms, decide where to extend migratory bird habitat; 2) I also mean it in the sense that those we traditionally consider land managers – farmers, pastoralists, peasants – are fast become data managers in and of themselves, be it as “smart” farmers or as pastoralists incentivize to go out and ground truth RS imagery.
Finally, we must understand the actual effects and outcomes of new techniques of data management. While it is crucial to recognize how data potentially connects domains in novel ways – i.e. when Skybox syncs ecological data with financial data – we should try not to reproduce discourse that “algorithms will rule our world.” If we do, we miss key resistances and ambiguities. We should remember that Skybox supports activists who feel that the technology can offer more visibility to illegal extraction activities be it in the Amazonian or Appalachia. We should be reminded to look for these fractures and to try to widen them, to realize that we can engage in a “politics of measure” that either questions the very measurability of things (Mann 2007; Robertson and Wainwright 2014) or asserts the strategic utility of doing so (Wyly 2007; Cooper 2014).
Which leads to the last big question to pose here: do we as political ecologists employ big data ourselves in support of our “hatchet and seed” mission? Is data just the object of our critique, along the lines I have laid out here? These are questions human geographers are asking themselves right now (Graham and Shelton 2013, special issue), some seeing it as an opportunity to rethink empirical social science in a more interdisciplinary way (Ruppert 2013), with others more cautious, suggesting big data are the epiphenomena of the real issue, and the real need is to question the datafied production of knowledge, to question the idea that big data is truth that simply needs mining (Wilson 2014). I think political ecologists have a lot to gain by reflexively engaging with the analysis of massive data sets, extending PE’s tradition of sitting critically if sometimes awkwardly (Walker 2005) between political critique and ecological fieldwork, cognizant that its own tools of research are often those it seeks to criticize (a la Lave et al. 2013; Turner 2003).
In short, I’m reminded again of Piers Blaikie, when in the 5th chapter of PESE,he sketches out what a grounded study of peasant political economy in the context of soil loss would look like. Literally sketches out what he calls “a schematic and heuristic device which suggests the way in which these complex relationships (between people, and between people and environment) can be handled.” And what does it look like?
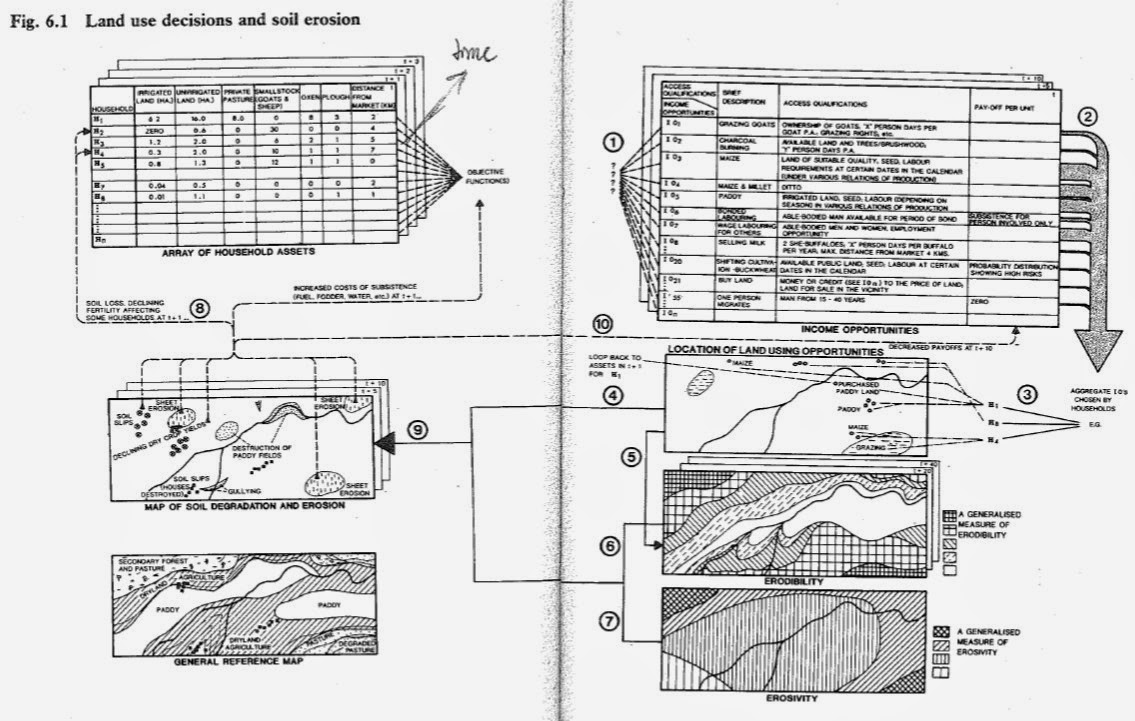 |
| Blaikie's heuristic for understand land use decisions and soil erosion. |
What else but a massive, complex, messy matrix of variables and objects of study (in this case, households? A big dataset. What is his critical relationship to this heuristic? He describes it as a watch – a watch keeps time, but it does not give its user any clue on how to use time. In the same way, the heuristic and the data it organizes are meaningful only in the context of political economic theory – it “maps” political economy onto the case study and “attempts to calibrate part of it precisely.” In other words, political ecologists might have our big data cake and eat it too. I’m not entirely sure what this engagement would look like concretely – the GLOBE project at the University of Maryland-Baltimore County is a likely candidate - but it seems to me that’s where we ought to be headed.